
Détecter des opportunités d'investissements en bourse avec l'analyse technique et le logiciel Aldexia.
Le logiciel d'analyse technique Aldexia Studio 2.2.0 est disponible en téléchargement.
Principales fonctionnalités du logiciel d'analyse technique Aldexia
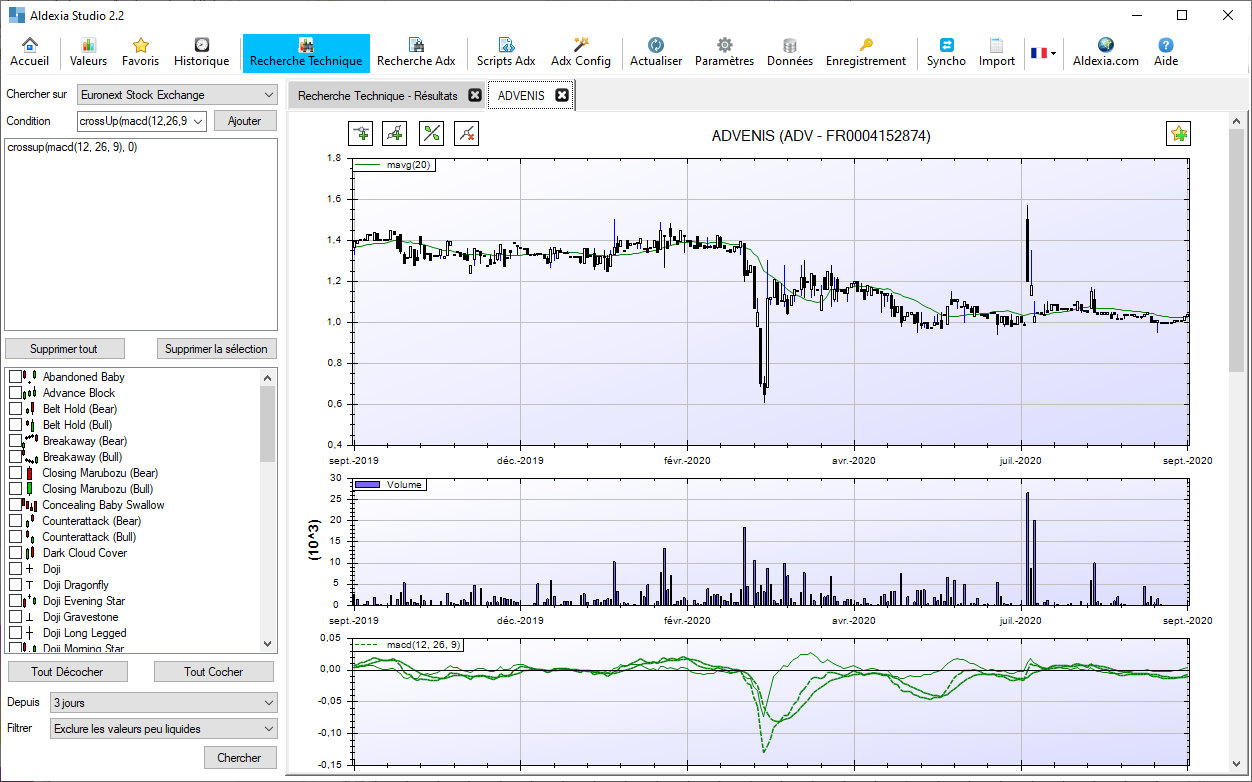
- L'analyse technique : Le logiciel boursier Aldexia dispose d'un moteur de recherche pour trouver immédiatement toutes les valeurs validant des critères d'analyse technique. Il est possible de combiner plusieurs critères d'analyse technique pour effectuer une recherche plus précise.
- Les chandeliers japonais : Le moteur de recherche du logiciel boursier Aldexia permet la détection des principales figures caractéristiques formées par les chandeliers japonais.
- Le langage de script Adx : Avec le langage de script Adx, il est possible de définir des règles complexes d'analyses techniques pour scanner un marché et trouver ainsi les valeurs qui valident vos propres critères d'analyses techniques. Les règles peuvent être haussières ou baissières et il est possible de tester vos règles d'analyses techniques sur les données historiques. Grace a l'utilisation de variables, il est possible d'étalonner vos règles d'analyses techniques en fonction des résultats de backtesting sur les données historiques.

